
Here are some code For more info, text me at: maricela.carrera@ibt.unam.mx
Data from sigma54 analysis.
Part of my project from my Ph.D in Science.
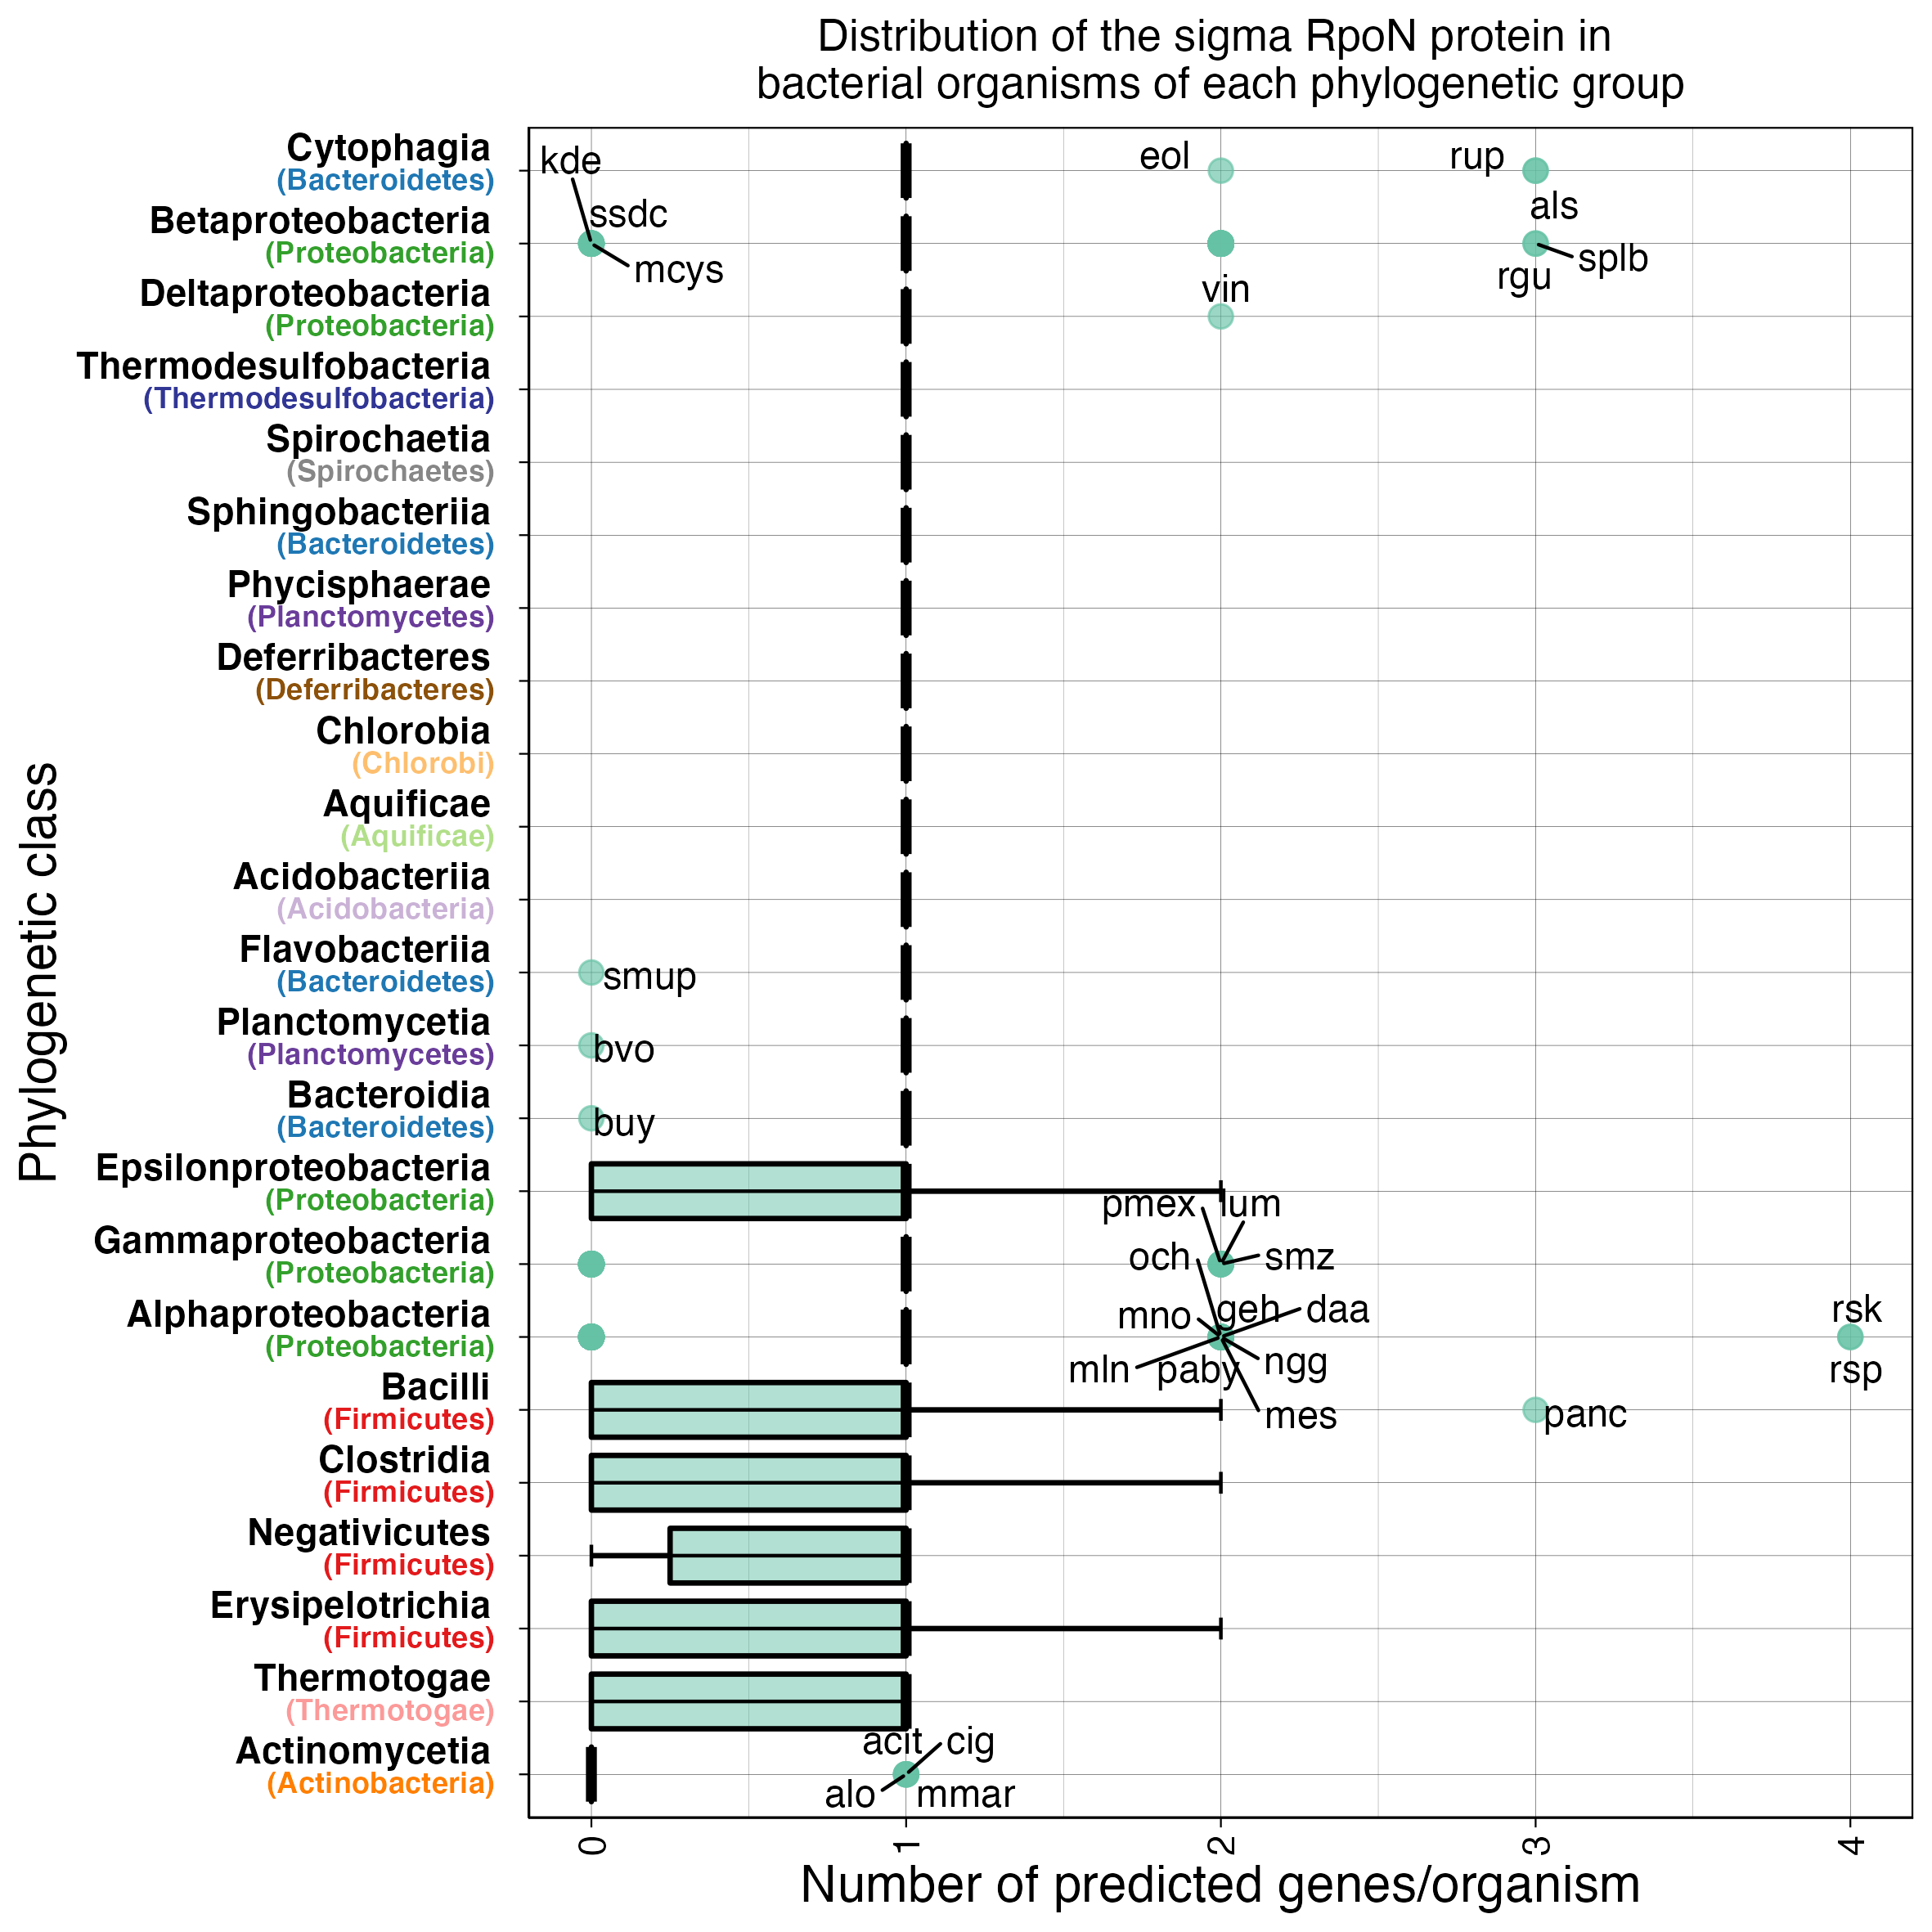
Distribution of the sigma RpoN protein in bacterial organisms of bacterial phylogenetic groups
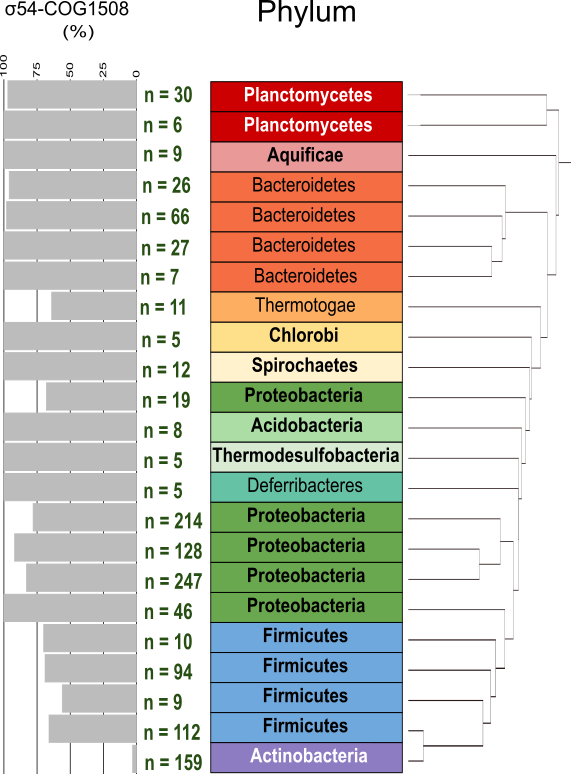
Itol tree: rRNA from 12 phyla, organisms representatives at class level.
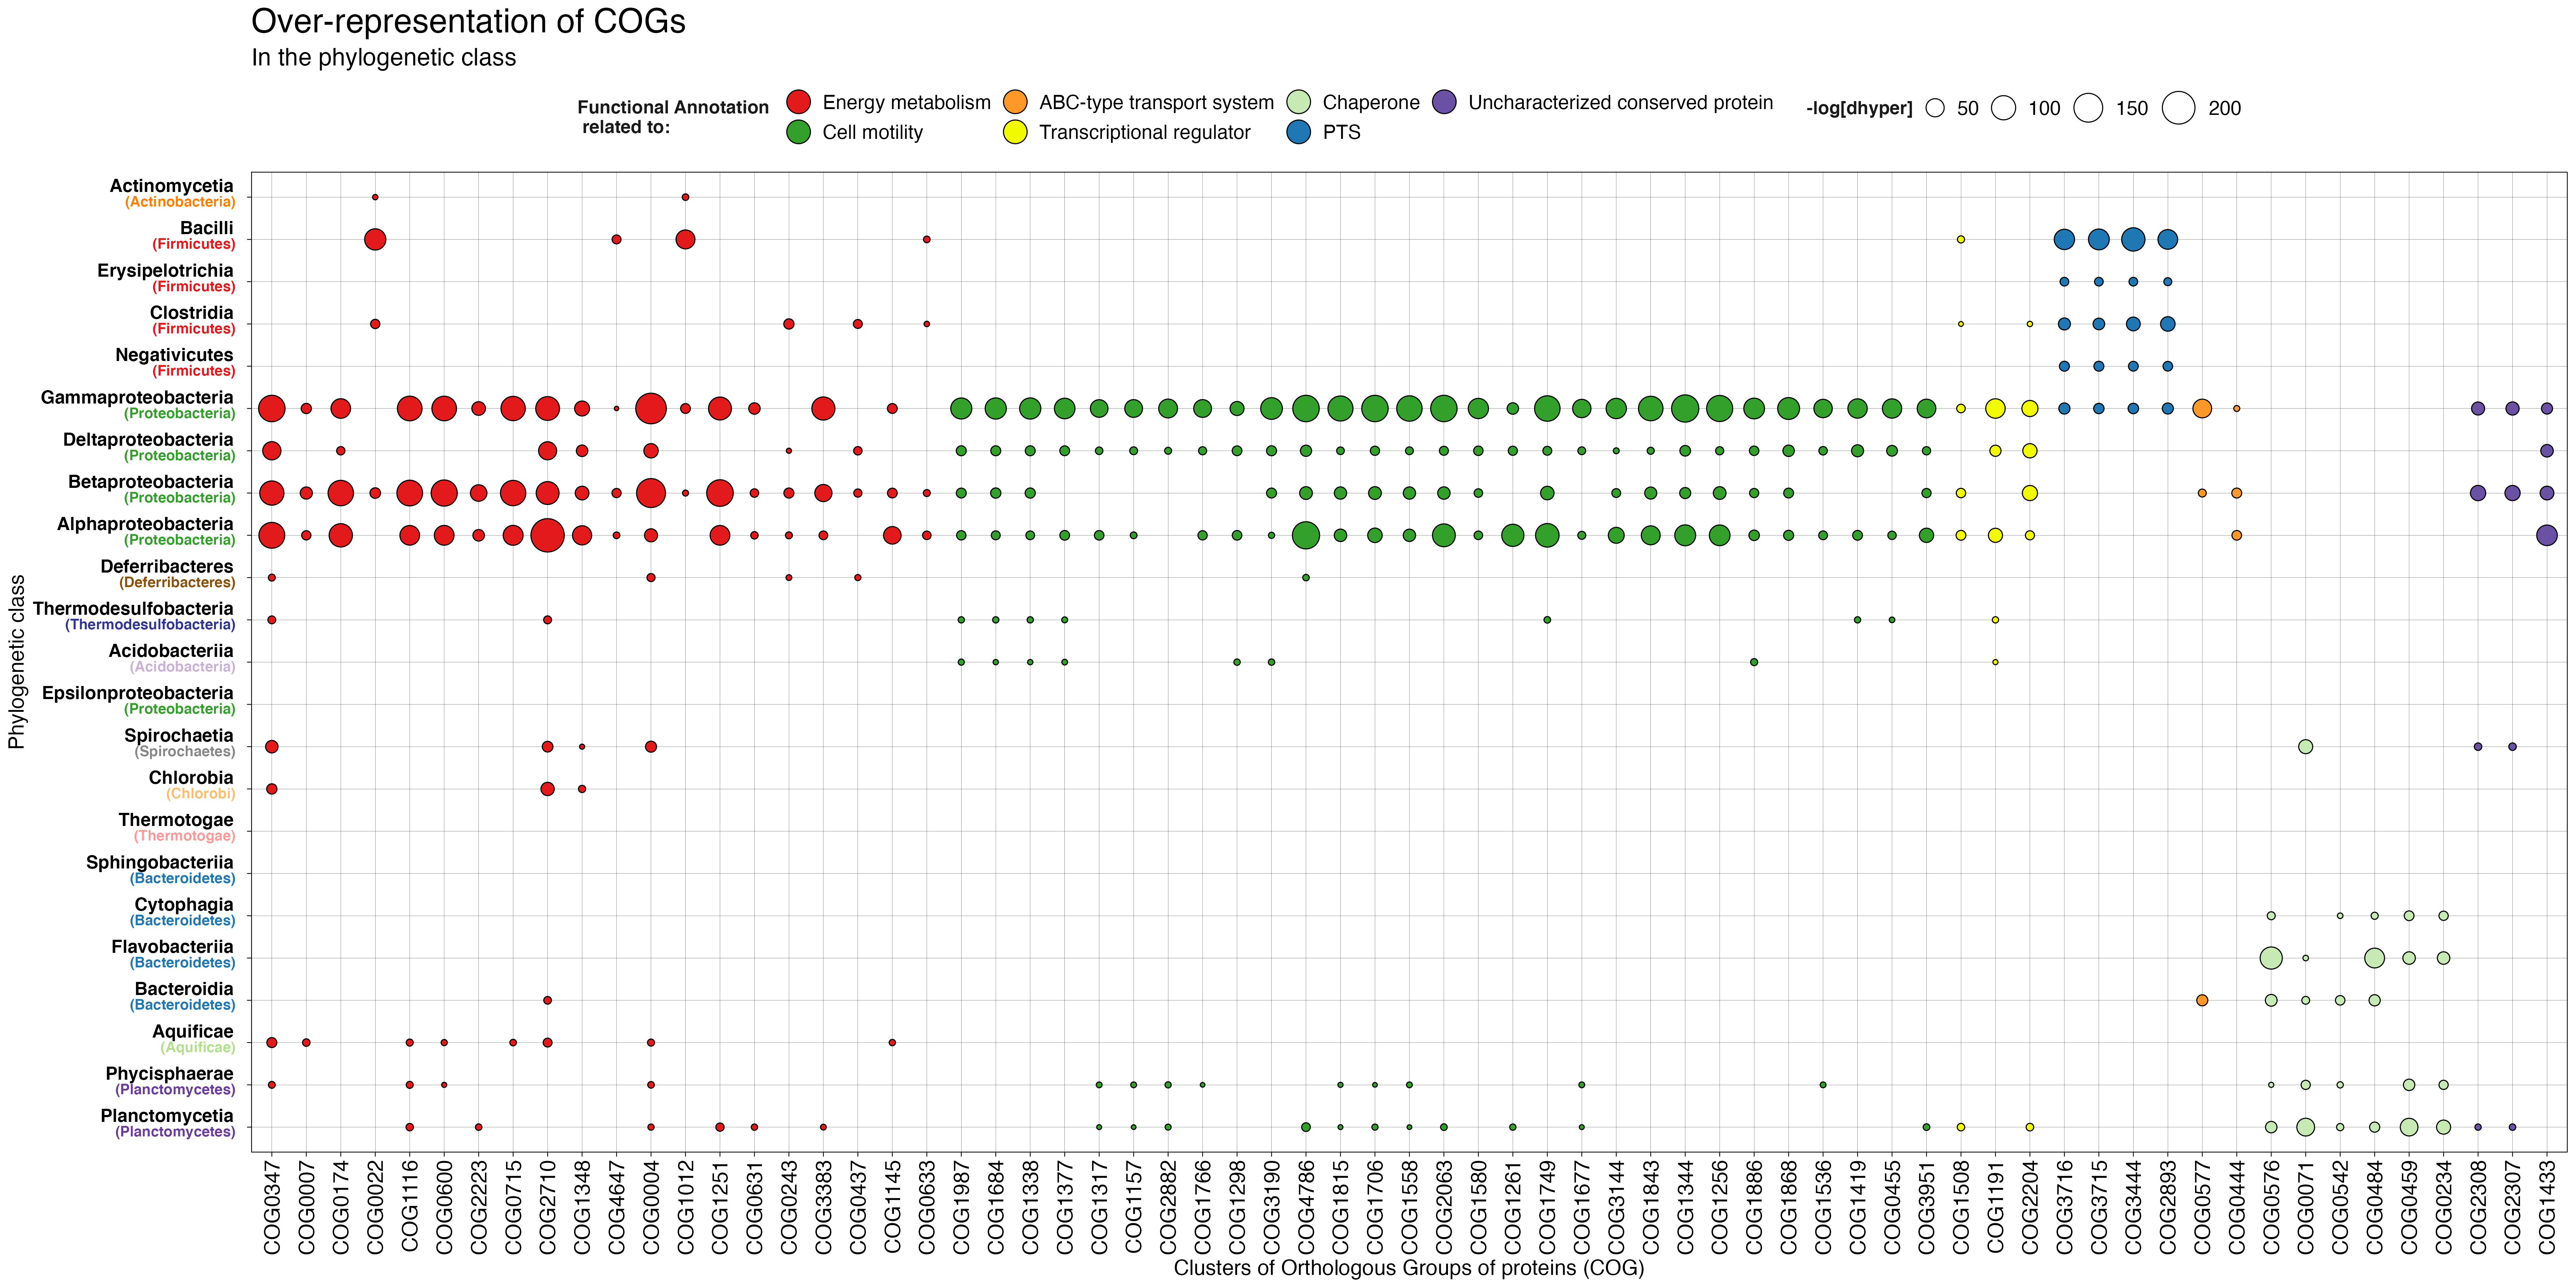
Clusters of Orthologous Genes (COGs) at RpoN Regulation
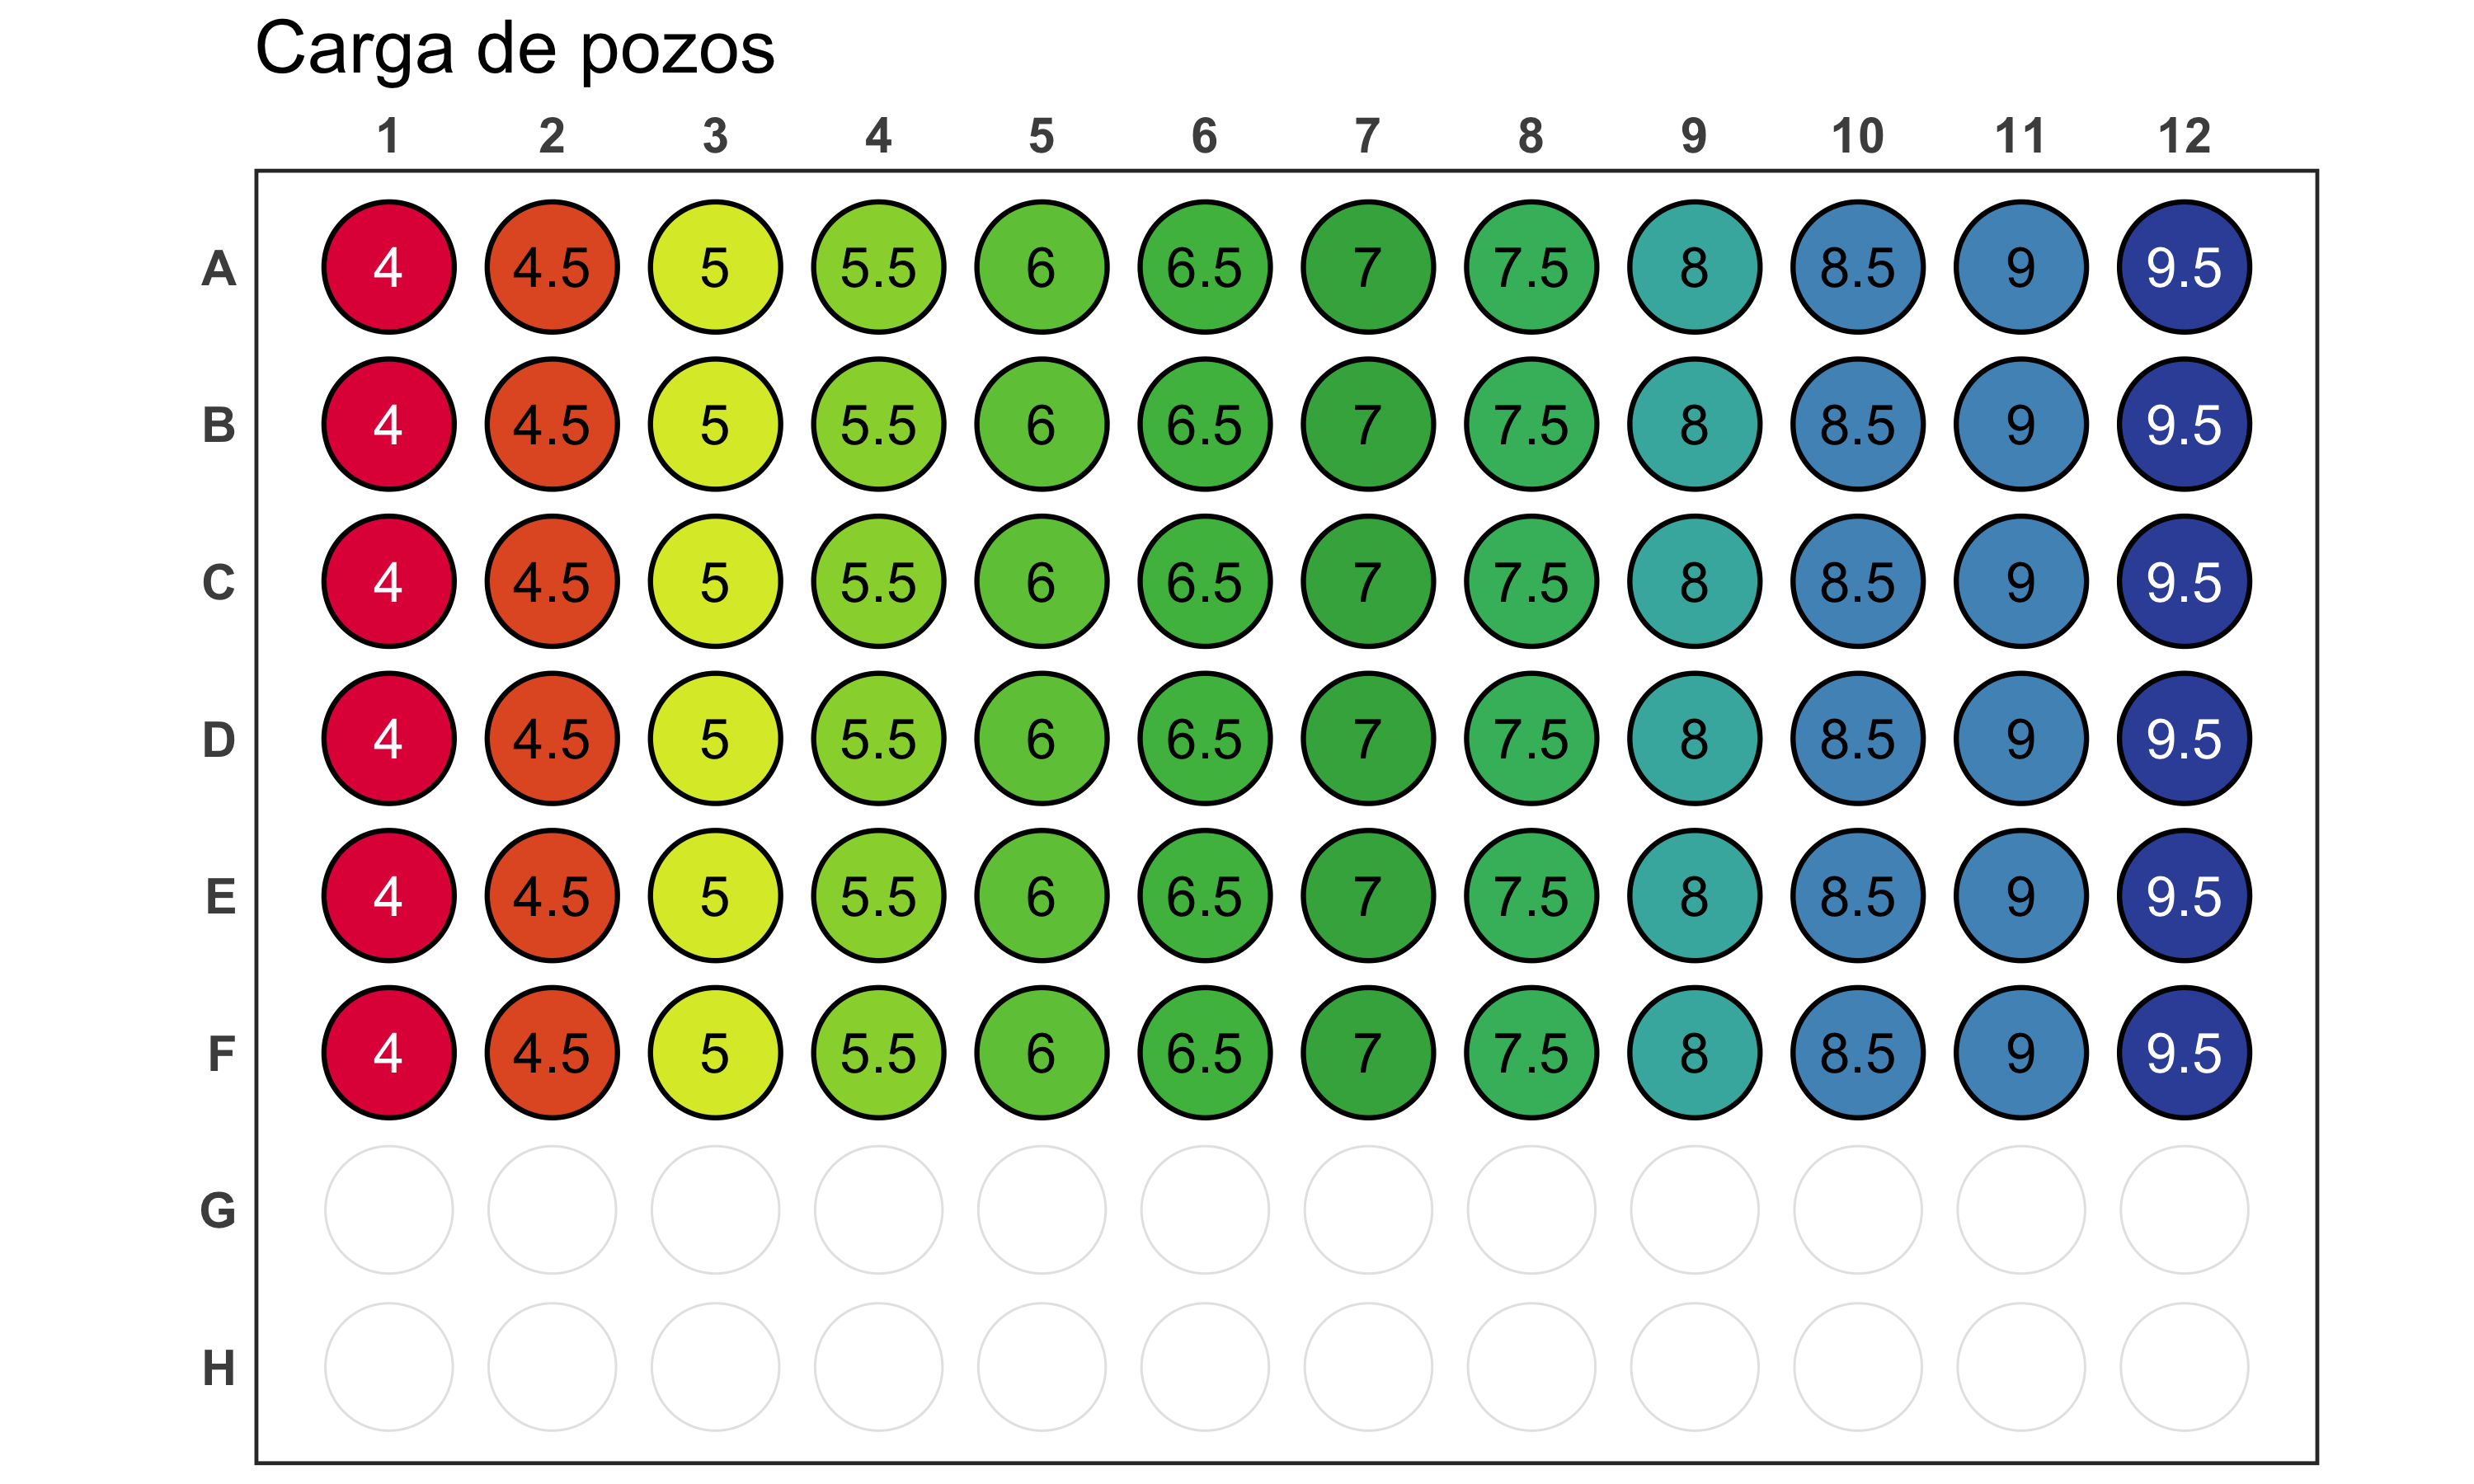
Some with experimental Data for representation of a plate.
With the package in R, ggplate
plate_plot_384_well_plate
CODE
Code
📊 Welcome to ggplate version 0.0.1! 📈

🖍 Have fun plotting your data! 💻
Code
library(ggplot2)
plate_02 <- read.csv("plate.csv", header = TRUE,sep = ",")
# Create a 48-well plot with adjusted legend limits
 png("plate_plot_384_well_plate.png", width = 10, height = 6, unit = "in", res = 300)
plate_plot(
  title = "Carga de pozos",
  data = plate_02,
  position = well,
  value = Value,
  plate_type = "round",
  label = Value,
  plate_size = 96,
  show_legend = FALSE,
  colour = c("#e11947","#e35b2b","#dbe930","#98d339","#6ec645","#4cbb4d","#3fae4d","#3fb96b","#43b3ac","#5194c1","#5194c1","#3852a8")
  #colour = c('#9e0142','#d53e4f','#f46d43','#fdae61','#fee08b','#ffeda0','#ffffbf','#e6f598','#abdda4','#66c2a5','#3288bd','#5e4fa2')
  )
dev.off()
Code
colour = c("#e11947","#e35b2b","#dbe930","#98d339","#6ec645","#4cbb4d","#3fae4d","#3fb96b","#43b3ac","#5194c1","#5194c1","#3852a8")